| Return
homepage
4 / 14 |
|
|||||||
| Following
page
|
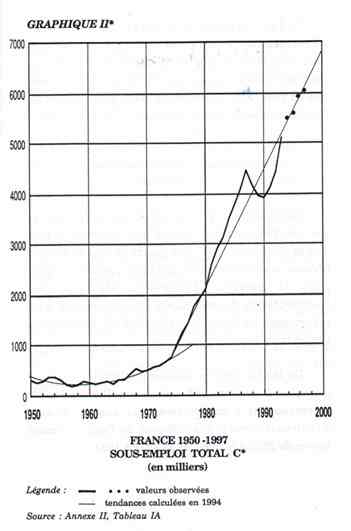
1.1.1 OFFICIAL UNEMPLOYMENT AND REAL UNEMPLOYMENT (Period 1950 - 1997) | |||||||
| Click on the curves for enlargment | 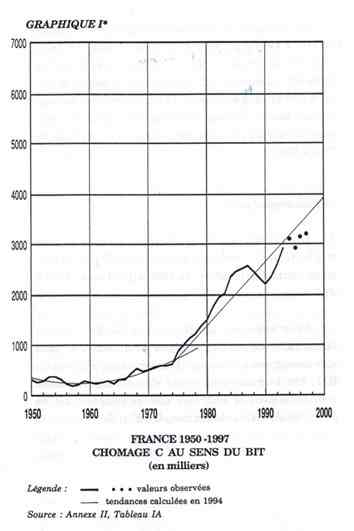 |
 |
||||||
| The left-hand curve represents the evolution of the total number unemployed in France, within B.I.T meaning (I.L.O.) (official figure). | ||||||||
| The right-hand curve shows the evolution of the total number of the unemployed persons, taking account of those who are eliminated from the statistics by the social treatment of the unemployment (real figure). | ||||||||
| Following page | ||||||||